
Objective
Let’s say you have 108 symbols in your watchlist and want to find out if a certain condition is met on the 5-minute chart.
Instead of clicking 108 rows (or using hotkeys to move up and down) and waiting for the chart to load and then checking the chart situation with your own eyes, we can automate this and be alerted only if the desired conditions are met.
There is a limit of 30 charts opened in DAS Trader Pro by default. If you are trading with multiple time frames and use some charts for watching SPY or some other tickers, there is not much left for real-time charts.
For this use case, we want to be alerted if the price is near or at HOD or LOD to spot possible reversal patterns.
TODO List
We will need
- As many charts as possible (18 in this case) chart with named indicators
- A dedicated scanner window with buttons
- A dedicated watchlist window
- The button's action scripts
- A script to read the values of the indicators on the chart
- A script to paint the buttons on the scanner
- A dummy montage window
- The chart update script to call the functions to read the chart and to paint the scanner buttons
- A trigger to enable/disable the scan
As many charts as possible (18 in this case)
Open 18 charts in a new tab. 18 because we have 108 symbols to watch, and 108/18=6, which means that in one minute we can split the checks in 10-second intervals. Every 10 seconds the scanner will move to the next 18 symbols to read the charts and indicate possible findings. It will repeat 6 times and then go from the beginning.
Name each chart window with a number. At the end you will have 18 chart windows opened named 1-18. Tile the charts on the screen. The charts will be black and empty by default.
When you are satisfied with the indicators and their names. Save the chart setting with a right click into a chart template file (5minX.cst in this case).
A dedicated scanner window with buttons
Open a fundamentals window, name it as scanner and add buttons to it.


The top 18 buttons are for the corresponding charts, and the bottom 3 are functional buttons.
A dedicated watchlist window
Open a new market viewer window and name it MYMKTVIEWER2. We usually already have one called MYMKTVIEWER hence the number 2.

Populate the watchlist with your symbols (at least 108 for this specific case)
The button's action scripts
The reset button
$strip=getwindowobj("scanner");
$i=1;
while ($i<19)
{
$strip.GetCustButObj("b"+$i).bkcolor="gray";
$strip.GetCustButObj("b"+$i).text="--";
$I=$i+1;
}
This code resets the button’s color and text. You can test it. If your buttons are named correctly (b1-b21), you will see the buttons to change the default text to —
The Load button
$row=1;
$a=GetWindowObj("MYMKTVIEWER2");
while($row<19)
{
$a.selectedrow=$row;
$WINDOW=GetWindowObj($row);
$a.selectedrow=$row;
$WINDOW.symb=$a.selectedsymbol;
$strip.GetCustButObj("b"+$row).text=$a.selectedsymbol;
$Window.loadsetting 5minX.cst;
$row=$row+1;
}
This button pre-loads the 18 created charts with the symbols from the watch list. It will load the saved chart template from step 1 and will change the button text to the corresponding symbols. So you will end up having 18 buttons named exactly the same as the first 18 rows in your watchlist.

The first time it will be without any color effects. Look at the charts tab to see if the charts have all the same template. It can look a bit messy, but we do not need to read them with our own eyes.

The scanner button
if($SCANNERENABLED==1)
{
$SCANNERENABLED=0;
$strip.GetCustButObj("b21").bkcolor="gray";
}
else
{
$SCANNERENABLED=1;
$strip.GetCustButObj("b21").bkcolor="green";
}
This button just triggers the functionality of the scanner on or off and changes the button color correspondingly to indicate it is enabled or disabled.

A script to read the values of the indicators on the chart
This script will read the values on the chart to symbol specific variables for later use. It will be called as a function, so it needs to be saved as a named hotkey. The name of the hotkey is setvars
setvar($MASTUDYNAME+"_"+SYMB,getstudyval($MASTUDYNAME));
setvar($ATRSTUDYNAME+"_"+SYMB,getstudyval($ATRSTUDYNAME));
setvar("LSTPRICE_"+SYMB,getstudyval($LSTPRICE));
setvar("LSIZE_"+SYMB,ABS(getvar("LSTPRICE_"+SYMB)-getvar($MASTUDYNAME+"_"+SYMB)));
setvar("DOUBLEATR_"+SYMB,ABS(getvar($ATRSTUDYNAME+"_"+SYMB))*2);
setvar("TIME_"+SYMB,ROUND(GetBar(0,"NumOFSeconds").time,0));
setvar("CUR_CDL_IDX_"+SYMB,getbar(0,"NumOfSeconds").time/60%5);
setvar("HOD_"+SYMB,getquoteobj(SYMB).HI);
setvar("LOD_"+SYMB,getquoteobj(SYMB).LO);
This can contain various calculations and all sorts of data readings. In this example you can see that it is storing values for studies like moving average, ATR, or price. Then uses calculated variables LSIZE and DOUBLEATR, which are calculated. Then the TIME and CUR_CDL_IDX variables, which are situation retrieval variables, and at the end, the values for HOD and LOD for the symbol. For our use case, we would be fine with just a few of the above.

A script to paint the buttons on the scanner
This script will also be called as a function, and it will compare the previously read values, and, based on the result of the predefined conditions, it will paint the scanner button red.
// close to hod
if(getvar("LSTPRICE_"+SYMB)>getvar("HOD_"+SYMB)*0.998)
{
$strip.GetCustButObj("b"+getwindowobj(NAME).NAME).bkcolor="red";
$strip.GetCustButObj("b"+getwindowobj(NAME).NAME).text=SYMBOL;
}

// close to lod
if(getvar("LSTPRICE_"+SYMB)<getvar("LOD_"+SYMB)*1.002)
{
$strip.GetCustButObj("b"+getwindowobj(NAME).NAME).bkcolor="red";
$strip.GetCustButObj("b"+getwindowobj(NAME).NAME).text=SYMBOL;
}
This is the place where you can let your fantasy loose and add as many conditions as you need by nesting the conditions deeper.
A dummy montage window
The market viewer is by default attached to a montage window. We do not want to mess up the scanner with the charts we are watching for the actual trading, so we need to link our watchlist to a dummy montage window.
The chart update script to call the functions to read the chart and to paint the scanner buttons
After having the function hotkeys prepared, we can now edit the chart update script with this short script
$MASTUDYNAME="Study9EMA";
$ATRSTUDYNAME="5minATR";
$LSTPRICE="lprice";
exechotkey("SETVARS");
exechotkey("PAINTBUTTONS");
The code sets the names of our studies and calls the setvars and paintbuttons hotkeys. This will be happening every time a change in the chart window is made. It can be a price change or a zoom level change.
Do it in one of the 18 charts and save the template as a new 5minX.cst

A trigger to enable/disable the scan
To start the scanning through the watch list, we need to jump the list by 18 rows. For this, we need another named hotkey. We will name it ScannerLoop.
$a=GetWindowObj("MYMKTVIEWER2");
$increment=18;

if(getsecond()%60==5)
{
$rowstart=1;
$rowend=$rowstart+$increment;
$row=$rowstart;
//msgbox(getsecond()%60);
//reset buttons
$strip=getwindowobj("scanner");
$i=1;
while ($i<19)
{
$strip.GetCustButObj("b"+$i).bkcolor="gray";

$I=$i+1;
}
//change symbols in buttons
$bi=1;
while($row<$rowend)
{
$a.selectedrow=$row;
$WINDOW=GetWindowObj($bi);
$a.selectedrow=$row;
$WINDOW.symb=$a.selectedsymbol;
$strip.GetCustButObj("b"+$bi).text=$a.selectedsymbol;

$row=$row+1;
$bi=$bi+1;
}
}

if(getsecond()%60==15)
{
$rowstart=19;
$rowend=$rowstart+$increment;
$row=$rowstart;
//msgbox(getsecond()%60);
//reset buttons
$strip=getwindowobj("scanner");
$i=1;
while ($i<19)
{
$strip.GetCustButObj("b"+$i).bkcolor="gray";

$I=$i+1;
}
//change symbols in buttons
$bi=1;
while($row<$rowend)
{
$a.selectedrow=$row;
$WINDOW=GetWindowObj($bi);
$a.selectedrow=$row;
$WINDOW.symb=$a.selectedsymbol;
$strip.GetCustButObj("b"+$bi).text=$a.selectedsymbol;

$row=$row+1;
$bi=$bi+1;
}

}

if(getsecond()%60==25)
{
$rowstart=37;
$rowend=$rowstart+$increment;
$row=$rowstart;
//msgbox(getsecond()%60);
//reset buttons
$strip=getwindowobj("scanner");
$i=1;
while ($i<19)
{
$strip.GetCustButObj("b"+$i).bkcolor="gray";

$I=$i+1;
}
//change symbols in buttons
$bi=1;
while($row<$rowend)
{
$a.selectedrow=$row;
$WINDOW=GetWindowObj($bi);
$a.selectedrow=$row;
$WINDOW.symb=$a.selectedsymbol;
$strip.GetCustButObj("b"+$bi).text=$a.selectedsymbol;

$row=$row+1;
$bi=$bi+1;
}

}

if(getsecond()%60==35)
{
$rowstart=55;
$rowend=$rowstart+$increment;
$row=$rowstart;
//msgbox(getsecond()%60);
//reset buttons
$strip=getwindowobj("scanner");
$i=1;
while ($i<19)
{
$strip.GetCustButObj("b"+$i).bkcolor="gray";

$I=$i+1;
}
//change symbols in buttons
$bi=1;
while($row<$rowend)
{
$a.selectedrow=$row;
$WINDOW=GetWindowObj($bi);
$a.selectedrow=$row;
$WINDOW.symb=$a.selectedsymbol;
$strip.GetCustButObj("b"+$bi).text=$a.selectedsymbol;

$row=$row+1;
$bi=$bi+1;
}

}

if(getsecond()%60==45)
{
$rowstart=73;
$rowend=$rowstart+$increment;
$row=$rowstart;
//msgbox(getsecond()%60);
//reset buttons
$strip=getwindowobj("scanner");
$i=1;
while ($i<19)
{
$strip.GetCustButObj("b"+$i).bkcolor="gray";

$I=$i+1;
}
//change symbols in buttons
$bi=1;
while($row<$rowend)
{
$a.selectedrow=$row;
$WINDOW=GetWindowObj($bi);
$a.selectedrow=$row;
$WINDOW.symb=$a.selectedsymbol;
$strip.GetCustButObj("b"+$bi).text=$a.selectedsymbol;

$row=$row+1;
$bi=$bi+1;
}

}

if(getsecond()%60==55)
{
$rowstart=91;
$rowend=$rowstart+$increment;
$row=$rowstart;
//msgbox(getsecond()%60);
//reset buttons
$strip=getwindowobj("scanner");
$i=1;
while ($i<19)
{
$strip.GetCustButObj("b"+$i).bkcolor="gray";

$I=$i+1;
}
//change symbols in buttons
$bi=1;
while($row<$rowend)
{
$a.selectedrow=$row;
$WINDOW=GetWindowObj($bi);
$a.selectedrow=$row;
$WINDOW.symb=$a.selectedsymbol;
$strip.GetCustButObj("b"+$bi).text=$a.selectedsymbol;

$row=$row+1;
$bi=$bi+1;
}

}
It seems long, but it is just 6 times the same action depending on the current time. It all starts 5 seconds into each minute, and then at seconds 15, 25, 35, 45, and 55, it will call the next set of symbols from the watch list. While this can be simplified and optimized, I keep it 6 times repeat for easier understanding and adds/removals for your customizations.
Now all that is left is to let the code run conditionally every second. Conditionally means if the Scanner button is green and the scanner is enabled. This is achieved by these lines in the event timer script.
if($SCANNERENABLED==1)
{
$montage.exechotkey("scannerloop");
}
The scanner in action
Once you enable the scanner with the button, it shall go through the watch list in 18 row increments, each for 10 seconds.
As it stays there for 10 seconds, each chart price update makes the call for detecting the conditions and repainting the buttons to red if the conditions are met. You can define your own conditions and calculations. It just needs to add the studies, read their values, do the calculations, and compare the conditions.
Taking it a step further
The buttons on the scanner can have their own function. For example, when clicking on the button, it will bring the symbol on the button to the main montage and the main trading charts into focus.
This is achieved by the following button code
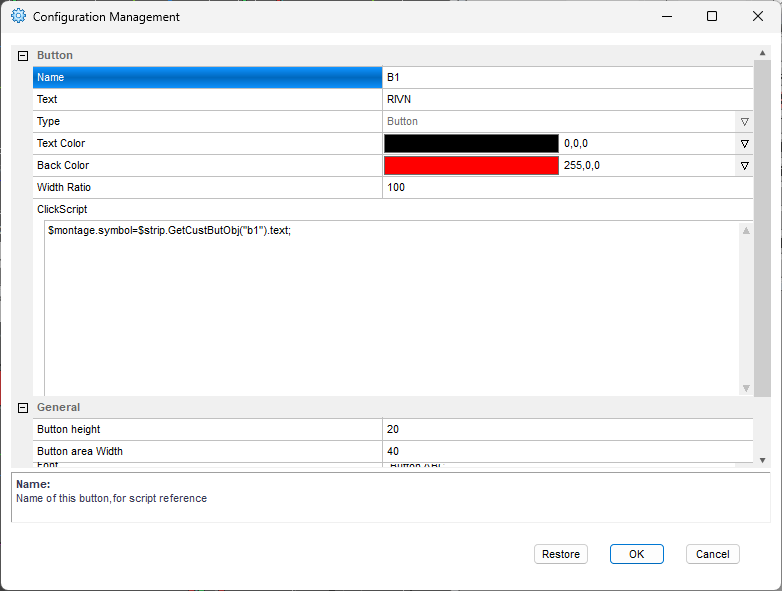
$montage.symbol=$strip.GetCustButObj("b1").text;You will need to change the button name b1 to b2, b3...b18 for each button.
If your watchlist is much longer, you can order the watchlist by price, volume or RVOL or just add a filter into the scanner.
For more advanced scripting, you can visit my Substack - Peter's Substack where I elaborate on the newest features, ideas and do custom solutions for specific needs.
Author: PeterB
Disclosure Statement 1. Hotkey scripts should always be thoroughly tested in a paper trading environment prior to any live deployment. Guardian Trading assumes no responsibility for errors, malfunctions, or financial losses arising from the use, misuse, or modification of custom hotkey configurations. Traders are solely responsible for the creation, testing, and implementation of their own scripts.This guide is provided for informational and educational purposes only and does not constitute trading advice or an endorsement of any specific configuration. The examples herein are illustrative in nature and should not be copied, replicated, or relied upon without independent verification and testing. Use of this material constitutes acknowledgment and acceptance of these terms.
2. No information provided by Velocity Clearing, LLC (“Velocity” or the “Firm”), directly or indirectly, should be considered a recommendation or solicitation to adopt any particular trading or investment strategy or to invest in, or liquidate, a particular security or type of security. Information provided by Velocity on its Twitter, Facebook or Blog pages is for informational and educational purposes only and is not intended as a recommendation of any particular security, transaction or strategy. Commentary and opinions expressed are those of the author/speaker and not necessarily those of the Firm. Velocity does not guarantee the accuracy of, or endorse, the statements of any third party, including guest speakers or authors of commentary or news articles. All information regarding the likelihood of potential future investment outcomes are hypothetical. Future results are never guaranteed. Any examples that discuss potential trading profits or losses may not take into account trading commissions or fees, which means that potential profits could be lower and potential losses could be greater than illustrated in any example. Users are solely responsible for making their own, independent decisions about whether to use any of the research, tools or information provided, and for determining their own trading and investment strategies.